


The AWS Lambda Call Addon for Splunk Enterprise, it provides custom alert action and dashboard for AWS Lambda server logs. Dashboard contains success rate, error rate for lamba calls and custom drill-downs. Which is useful to gain visibility and add insights to your aws lambda function logs.
Using this App: When an alert is triggered,It will automatically call the respective AWS Lambda function. AWS lambda function will provide a response which can be visible in splunk dashboard. Splunk Admin can easily track counts of AWS Lambda triggered via Splunk Dashboard.
AWS Lambda App for Splunk Enterprise provides a dashboard which will gives an overview of:

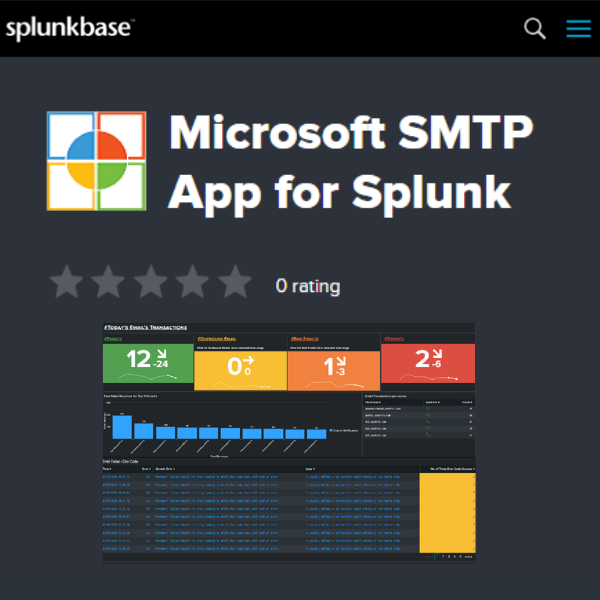
The SMTP IIS Add-on for Splunk, use this to onboard SMTP data to Splunk in W3C Extended Log File Format. It further gives highly optimized Splunk dashboards, reports and alerts for Simple mail transfer protocol server logs.
Using this App: Make required changes in given eventypes and onboard SMTP IIS server logs using the UF from data server also configure timezone in props.conf indexer.
Microsoft SMTP App for Splunk provides a dashboard which will gives an overview of:
Reports: Reports are used to show information about all the error code, outbound email sent and bounced email details.
Alerts : Alerts will get triggered as per scheduling and triggering condition for error code, outbound email sent and bounced email event occurrence.
Gogs application is a Version control System (VCS) software. It can also be used to control Splunk Configuration. The Gogs app for splunk offers a rich set of pre-built dashboards to analyze and visualize data from Gogs – including file created, modified, deleted, issues, pull request, commits, fork and release - all in single, free app.
Each dashboard panel contains dynamic inputs like select repository, user name and time. Below are the major use cases for this app are to investigate


The Add-on provides a valuable insight into the bitwarden account of your organization such as user's activity, password changes, passwords share, etc.
Bitwarden Add-on leverage data from bitwarden to Splunk via API Call. It uses multiple API to fetch data from bitwarden like a list of event logs, members, groups, and policies.

In today's computing world, firewall is must for network security system build, as it prevents unauthorized access to or from a private network. It monitors and controls incoming and outgoing network traffic based on predetermined security rules.
Below are the major use cases for this app are to investigate
The Zyxel firewall monitor app is based on logs that has being forwarded to splunk by receiving at port 514 which is default. Also the apps default setting for index, sourcetype is being saved in Eventtype, you can change this setting as per your configuration from the link provided in apps home dashboard.
The Zyxel Add-on for Splunk Enterprise (TA_Zyxel_Splunk) sets the correct sourcetype, fields used for identifying data from Zyxel firewall using Splunk® Enterprise & Splunk® Cloud for all the categories of logs. This also allows Splunk software administrators to map Zyxel firewall device events to the Splunk CIM.


OS Ticket Addon for Splunk is an alert action which creates ticket, when an alert is triggered in Splunk. The addon uses API key to communicate with OS Ticket Platform. Also multiple parameters would be required to create tickets in OS Ticket Platform
OS Ticket Addon for Splunk provides a dashboard which will gives an overview of:
Clockify App for Splunk lets you keep track team of activities on basis of projects, time, productivity and tasks on Clokify. One can get multiple workspaces entries within the single dashboard here,so you dont worry about switching from one workspace to another to see clockify app statistics.


Clockify is time tracking & timesheet app. The Add-on fetches valuable insights from clockify account of your organization such as user's information, timesheet's detail via REST APIs and ingest it in Splunk.
Twilio Alert Action lets you send SMS with the help of messaging API's. With Twilio, you can send notifications, alerts, and marketing messages on multiple channels with one API that has software for managing phone numbers, deliverability, compliance, and replies.

Twilio Add-on for Splunk leverage Twilio message and call API's and integrate them with Splunk to get data.
Twilio sends notifications, alerts, and marketing messages on multiple channels with one API that has software for managing phone numbers, deliverability, compliance, and replies. With the Twilio logs, this addon provides detailed insights of Twilio account usage.

Cisco ThousandEyes delivers the most comprehensive visibility into digital experience for applications and data center and cloud-hosted services, to customers and employees located anywhere.
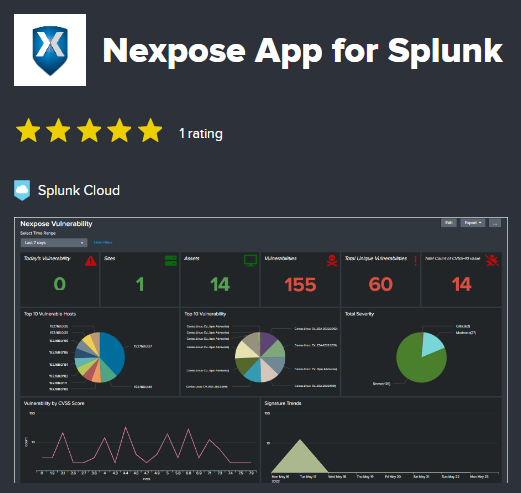
This Splunk App will give you an Insight into the Rapid7 Nexpose logs by using various Knowledge objects.
The Capture Dashboard app allows you to take the Screenshot of your dashboard and download it as a pdf with a click of a button.